Construction Gantt chart software: what to test in a demo
A useful Gantt chart connects dates to work logic. Test whether a schedule changes correctly when a predecessor slips, whether baseline dates remain visible, and whether the site team can provide usable progress updates.
Separate a timeline picture from a schedule
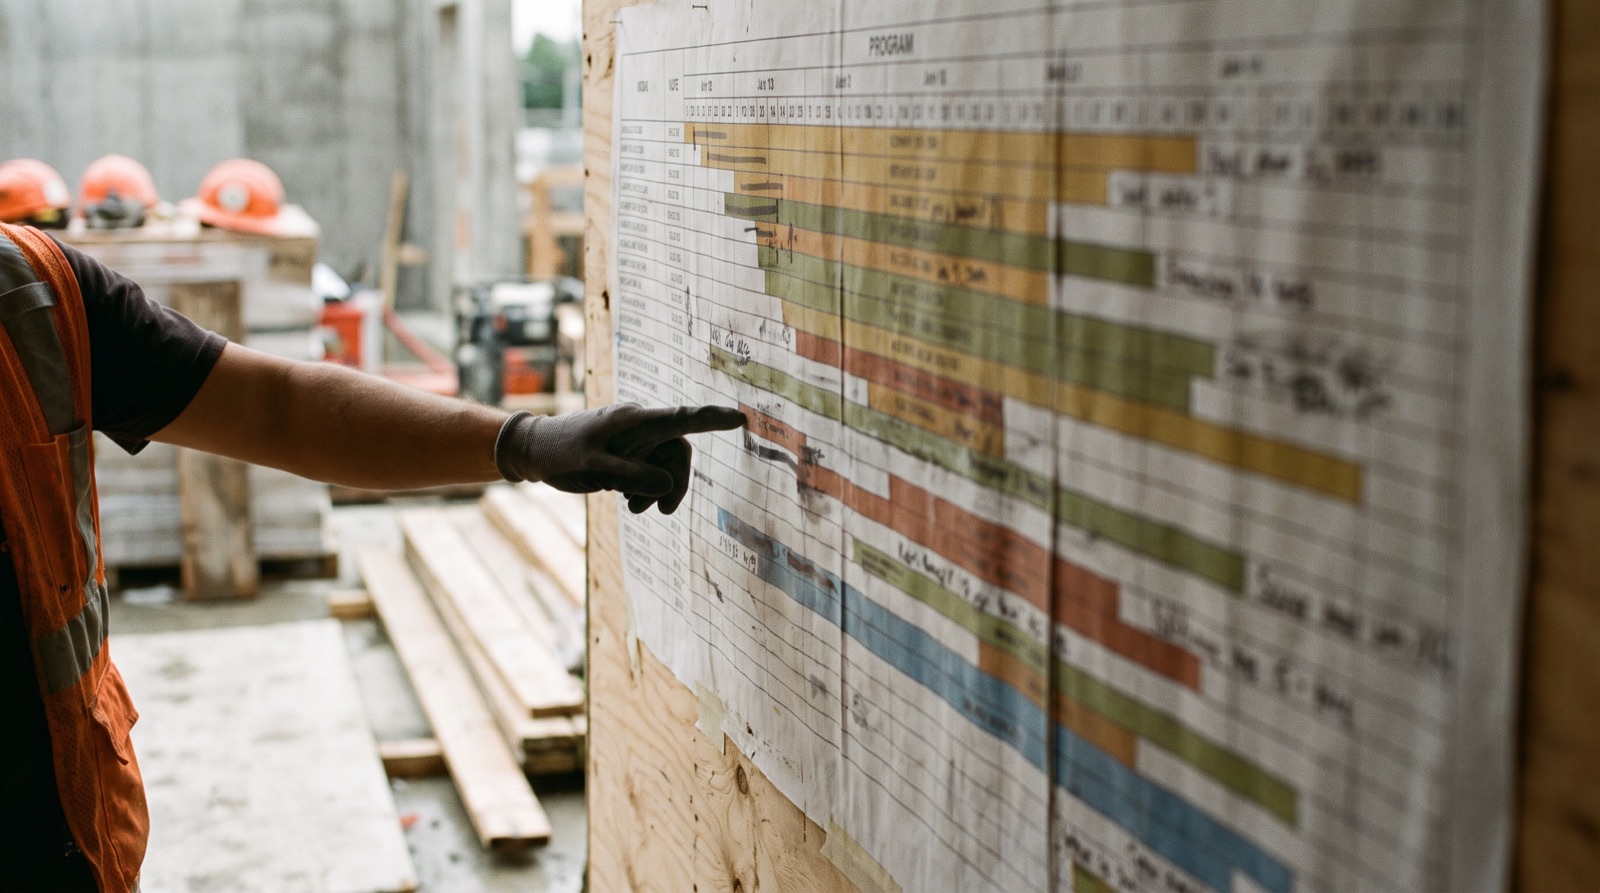
A Gantt chart displays activities against time. The underlying schedule should explain why activities start when they do. A bar that can be dragged to any date may look convincing while hiding an impossible dependency. Ask the vendor to show predecessor relationships, working calendars and remaining durations, not only colours and a percentage-complete field.
Bring a small network to the demo
Use an illustrative sequence: approve a detail, procure the item, receive it, install it, then inspect it. Add another activity that can proceed independently. Enter the same durations and work calendar in each tool. Have a planner check the logic before using the result for a live project.
| Test | What a reviewer should see |
|---|---|
| Predecessor delayed | Consequential dates change according to the entered logic |
| Non-working day | The selected calendar affects the forecast |
| Baseline saved | Original dates remain available for comparison |
| Actual start entered | Completed history is distinguishable from remaining work |
| Constraint added | The constraint and its effect are visible |
| Schedule exported | Recipients can identify activities, dates and version |
Test updates from the field
Ask a supervisor to record that an activity has started but has more work remaining than expected. Then ask the planner to update the forecast without rewriting history. Check whether “50% complete” has a defined basis: elapsed time, measured quantity and remaining duration are different observations. The tool should support the method your team has agreed, rather than make a percentage a substitute for an estimate.
Check the weekly review view
The project manager needs upcoming milestones, forecast changes and decisions that block progress. The site team may need a short lookahead with location and trade information. The client may need only approved milestones. Test each view with the intended permissions and ensure different views do not become conflicting schedules.
Inspect logic before accepting the critical path
Missing dependencies and arbitrary date constraints can produce misleading schedule results. The GAO Schedule Assessment Guide discusses sound scheduling practice, including a valid critical path and reasonable float. Its guidance is a reference for review, not a substitute for a planner checking your project model.
Compare evidence, not vendor claims
Record which requirements each tool demonstrated with your sample, which need configuration and which were not shown. This article does not rank named vendors or claim that Bullet already offers a production scheduling engine. Use the downloadable checklist to keep the evaluation reviewable.
Common questions
- What is the difference between a Gantt chart and a schedule?
- A Gantt chart displays activities against time. The underlying schedule should explain why activities start when they do, through predecessor relationships, working calendars and remaining durations.
- What should you test in construction scheduling software?
- Whether dates change correctly when a predecessor slips, whether calendars affect the forecast, whether baselines stay visible, and whether actual progress is kept separate from remaining work.
- How should site progress update a schedule?
- The planner should update the forecast without rewriting history, and any percentage complete needs a defined basis such as measured quantity or remaining duration.
Construction scheduling software checklist
A blank CSV you can open in Excel or Google Sheets. Adapt the fields to your project. No signup required.
Download CSV